

Question:
How can I trace SQL queries or errors using MSSQL Profiler?
Answer:
Please refer to the following guide to trace SQL queries or errors using the MSSQL Profiler;
How can I trace SQL queries or errors using MSSQL Profiler?
Answer:
Please refer to the following guide to trace SQL queries or errors using the MSSQL Profiler;
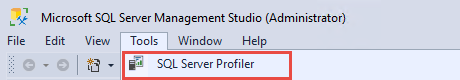
1. Open MSSQL Management Studio → Tools → SQL Server Profiler.
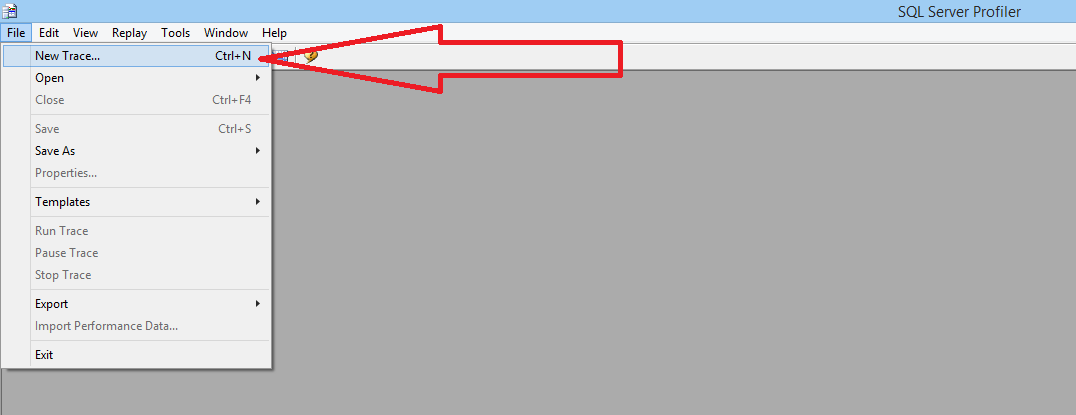
2. Open File, then select "New Trace...".
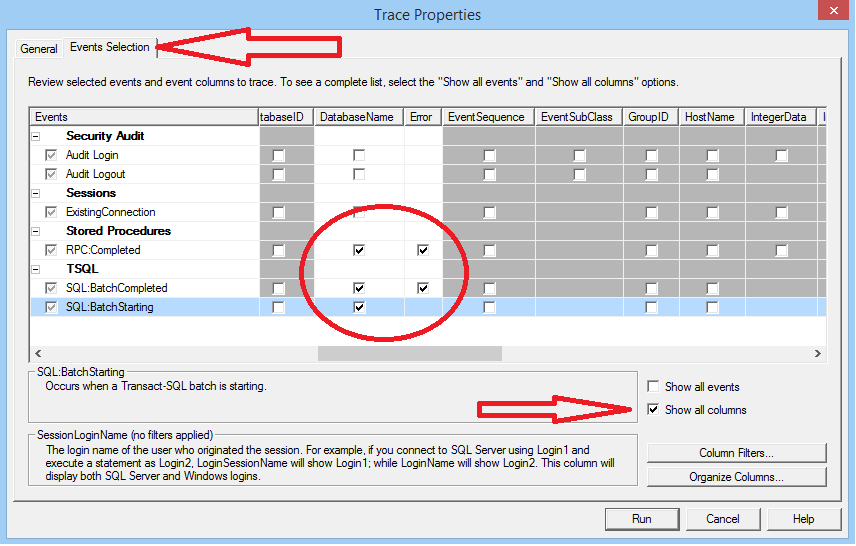
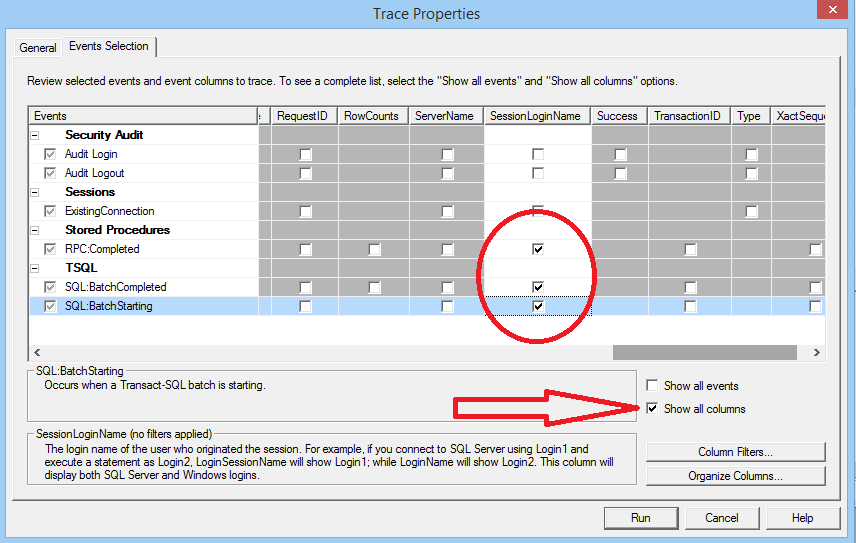
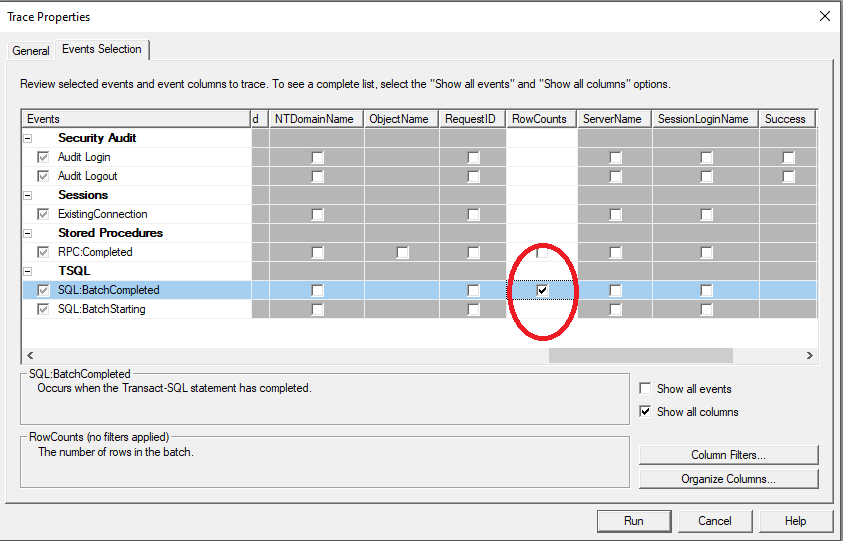
3. Go to the Events Selection Tab, enable "Show all columns" then check the following checkboxes found under the DatabaseName, Error, and SessionsLoginName columns:
2. Open File, then select "New Trace...".
3. Go to the Events Selection Tab, enable "Show all columns" then check the following checkboxes found under the DatabaseName, Error, and SessionsLoginName columns:
RPC:Completed
SQL:BatchCompleted
SQL:BatchStarting
SQL:BatchCompleted
SQL:BatchStarting
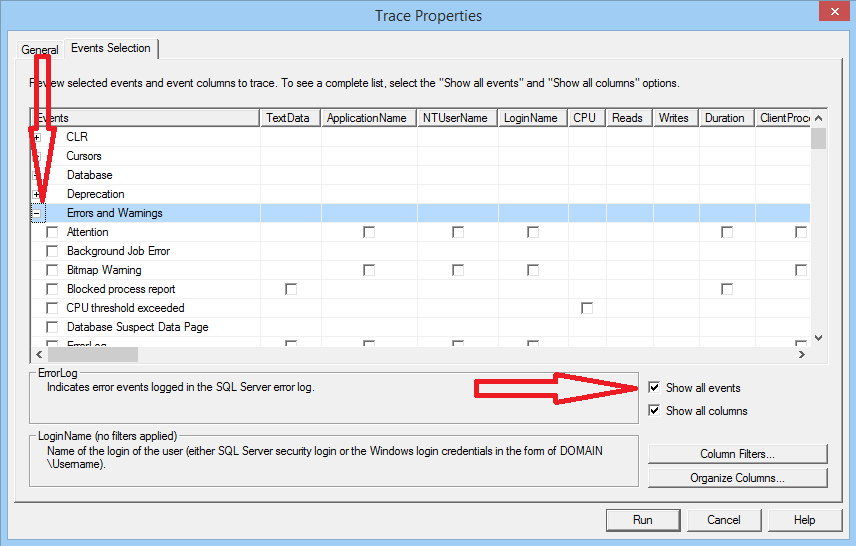
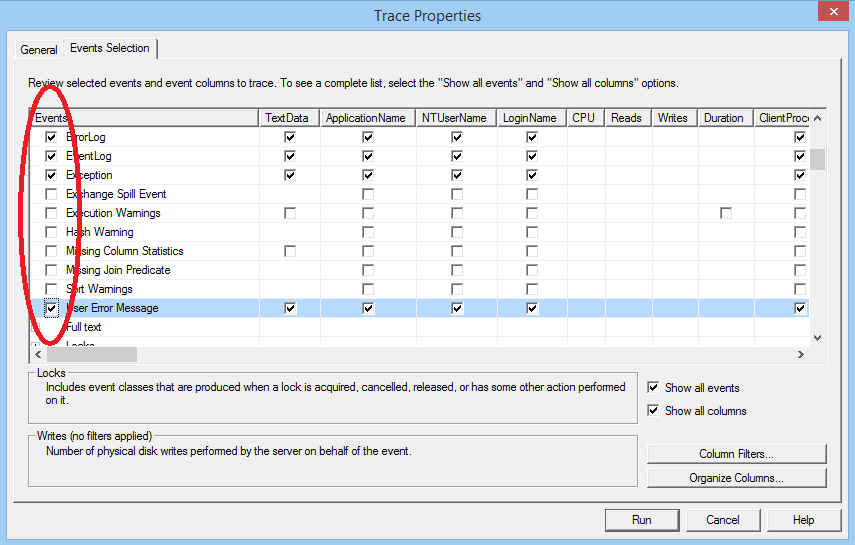
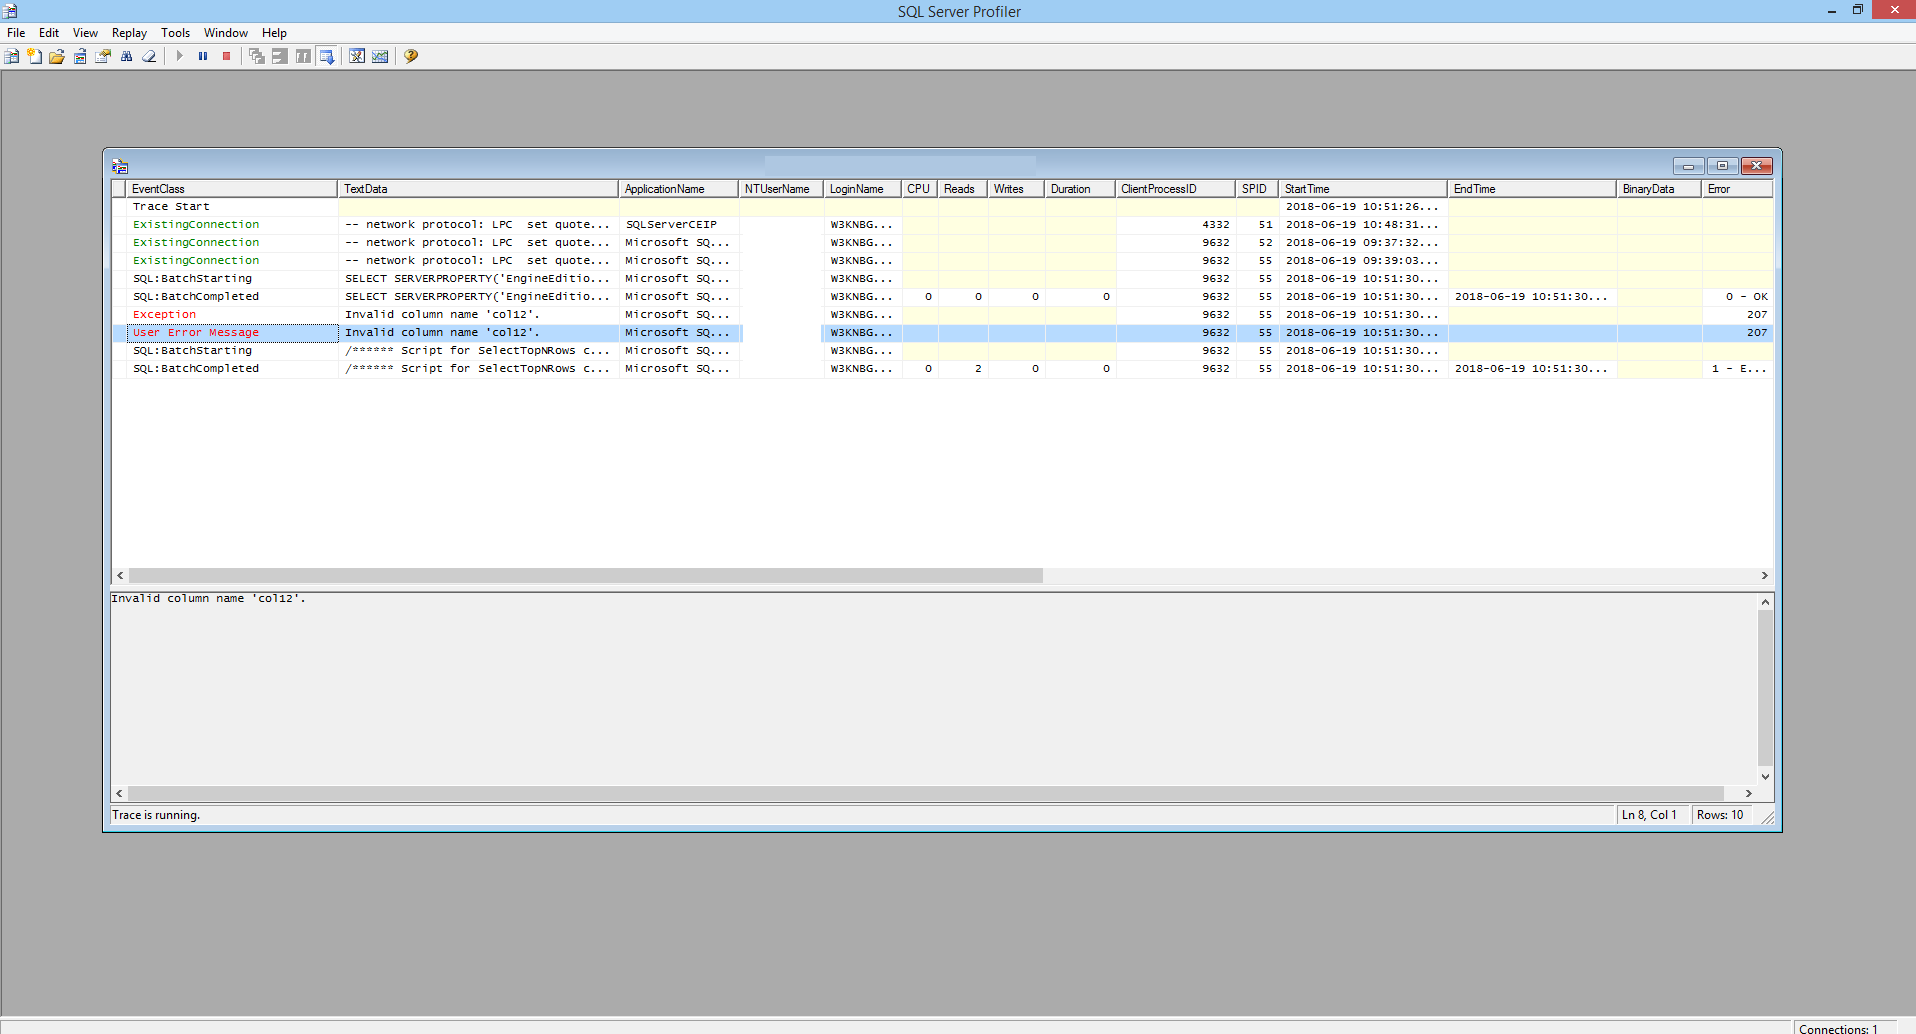
4. Enable "Show all events" and select the Events ErrorLog, Eventlog, Exception, User Error Message under "Errors and Warnings"
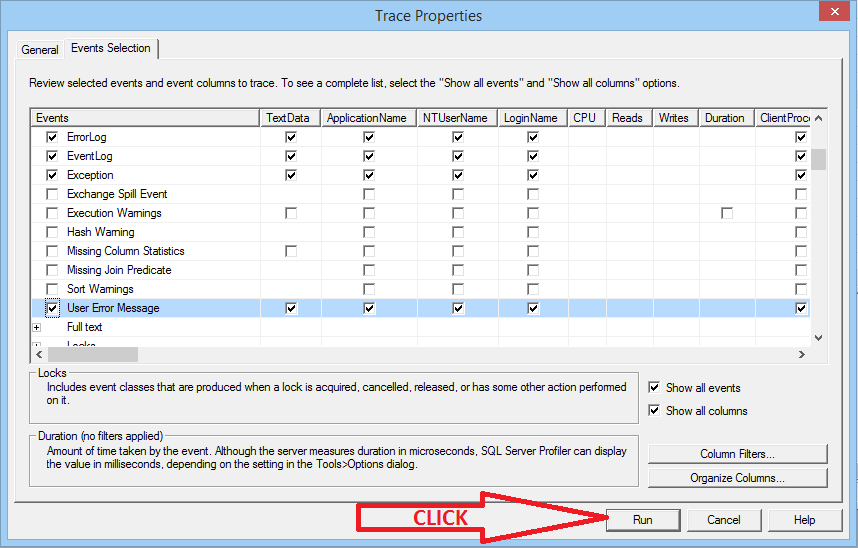
5. Once completed, run the trace.
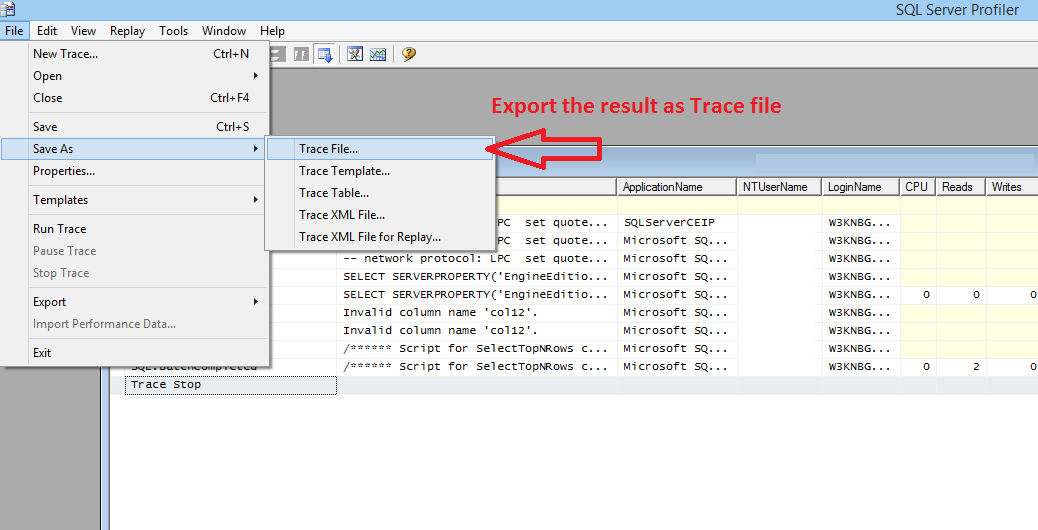
6. After replicating the error or running the needed SQL queries, open File → Save as → Trace File.
KBA is applicable for On-premise Organizations ONLY.